My Cholesterol Went From 225 to 466 in 30 Days
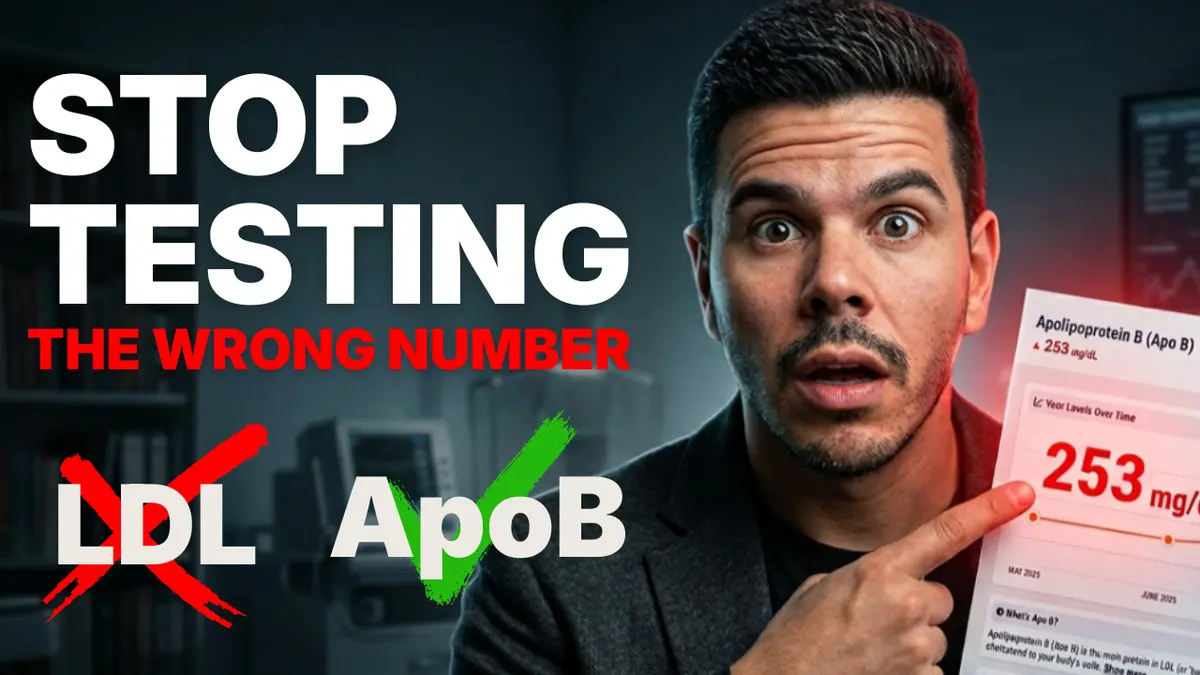
A couple of years ago I ran a carnivore diet experiment and pulled blood work before and after. The results were striking. Total cholesterol went from 225 to 466. LDL went from 150 to over 350, so high the lab didn't even report a number, just a flag.
Show that to most doctors and they panic. Show it to the low-carb internet and half of them will tell you it's fine, even good. HDL went up. Particle size stayed large and fluffy. The carnivore crowd will tell you those are the harmless kind.
But one number in my labs more than doubled. It's the only one on that page that actually predicts a heart attack. And there's a second number I didn't even test for that predicts it even more accurately.
By the end of this article, you'll know exactly what both numbers are, why they beat the standard cholesterol test you already get, and why your doctor has probably never ordered either one.
What Cholesterol Actually Is
Before getting to the numbers, this foundation matters.
Everyone knows LDL is the bad cholesterol and HDL is the good one. What almost nobody knows is what those letters actually mean. The L stands for lipoprotein, and understanding that word changes how you interpret every lab result you've ever seen.
Cholesterol and fat don't dissolve in blood. Blood is essentially water, and fat and water don't mix. Your body can't just float cholesterol around loose. So it wraps cholesterol and fat inside a protein shell, like packing cargo into a truck. That package is a lipoprotein. The fat is the cargo inside. The protein shell is the outer layer. Together they make a fat molecule that can travel through your bloodstream.
Two types of these trucks matter for heart disease risk.
The first truck leaves your liver full of fat and drops it off along the way. It starts as a VLDL particle, becomes a remnant when it's partially unloaded, and becomes an LDL particle once it's mostly empty. Don't get lost in the names. It's one truck going through three stages as it delivers its cargo.
The second truck is HDL, a completely different vehicle with a completely different job, essentially collecting cholesterol and returning it to the liver.
Everything else in this article is about the first truck.
The Tag That Changes Everything: ApoB
Here's the part that your standard cholesterol panel completely misses.
Every LDL, VLDL, and remnant particle carries a specific protein tag called ApoB. One particle, one tag. HDL doesn't carry it. That tag is how you count the trucks.
When your doctor measures LDL cholesterol, they're measuring the total weight of cargo inside the trucks on the highway. When they measure ApoB, they're counting the total number of trucks on the road.
That distinction matters enormously. Traffic accidents aren't caused by how heavy the cargo is. They're caused by how many trucks are on the road. Too many trucks means too many opportunities for particles to crash into your artery walls, get stuck, and build plaque.
Your standard panel tells you how much cholesterol your trucks are hauling. It never tells you how many trucks there are. ApoB tells you how many trucks.
Four Scenarios That Determine Your Real Risk
Once you understand the truck count versus cargo weight distinction, every cholesterol result falls into one of four categories:
Low LDL, High ApoB. Heavy cargo but many trucks on the road. Even though total cholesterol looks fine, you have a massive number of particles hitting your artery walls. Standard tests miss this completely. High heart risk.
High LDL, High ApoB. Lots of trucks carrying heavy loads. A crowded highway. High heart risk, and this one at least shows up on a standard panel.
High LDL, Low ApoB. A handful of massive trucks carrying heavy cargo. Your LDL number looks alarming on paper but because there are very few physical particles on the road, your actual risk is much lower. This is what carnivore diet advocates are often pointing to when they say their numbers look fine.
Low LDL, Low ApoB. Very few trucks, almost no cargo. Clear highway. Lowest heart risk scenario.
The critical insight: your standard panel handles scenario two reasonably well. It completely misses scenario one, which is high risk with a normal-looking LDL. And it systematically overestimates risk in scenario three, where LDL looks high but particle count is low.
Two Numbers Your Panel Is Missing
Remnant cholesterol is the half-empty truck problem. Remnant particles are stickier than LDL and penetrate artery walls even more easily. They're not directly reported on a standard panel. You calculate them by subtracting HDL and LDL from your total cholesterol. One catch: depending on how your lab calculated LDL, that math might just hand you back your triglyceride number. Ask your lab which method they used to calculate LDL. It's a simple call.
Lp(a) is the second number, and it's arguably more important. Lp(a) is an LDL particle with an extra protein tail attached. That tail behaves like a clotting protein, which means it promotes both plaque buildup and clot formation. The critical thing to know: your Lp(a) level is set by your genes, not your diet. No amount of clean eating or exercise will bring it down significantly. Pharmaceutical companies are actively developing drugs to address it because lifestyle alone can't.
One in five people carry high Lp(a). You want it under 30 mg/dL or under 75 nmol/L depending on your lab's units. You only need to test it once in your life because it doesn't change. When I ran my carnivore experiment, I didn't test for Lp(a). I should have. Most people never have.
Why Particle Size Doesn't Save You
When I shared my carnivore lab results publicly, the most common response was some version of: your particles are big and fluffy, so you're fine.
It's true that LDL particles come in different sizes. Small dense particles do show up more frequently in heart disease. The story goes that large fluffy particles are harmless. This idea isn't invented from nothing. But when researchers asked whether size still mattered once you controlled for total particle count, size stopped predicting anything. In genetic studies, it fell apart completely. If anything, larger particles looked slightly worse.
Here's why, using the truck analogy. A particle doesn't become small because it's a different kind of vehicle. It becomes small because it lost its cargo along the way. A large fluffy truck and a small delivery van are both small enough to crash into your artery wall. When a large fluffy truck crashes, it actually dumps more debris because it was carrying more cargo.
Particle size is not an independent risk factor once you know the count.
You don't even need to test separately for particle size. Divide your LDL by your ApoB and you get a ratio. A ratio around 1.3 indicates the large fluffy pattern. But size was never its own thing. It's just your cholesterol load divided by your particle count.
Here's what happened in my own numbers. Before carnivore, my LDL divided by ApoB ratio was 1.4, textbook large and fluffy. After carnivore, it was still exactly 1.4. Identical particle size before and after. But my ApoB went from 1.09 to 2.53. I didn't change the size of the trucks. I put more than twice as many trucks on the road. Same fluffy particles. Double the count. And the count is what ends up in your artery wall.
My cholesterol number didn't concern me after that experiment. My ApoB did.
Why Your Doctor Has Never Ordered It
This is not a conspiracy. It's a history problem.
Cholesterol research came first. Forty years of guidelines, clinical practice, and insurance reimbursement built around a single number. ApoB simply isn't in the checkbox your doctor clicks when ordering a standard lipid panel.
What makes this frustrating is that ApoB costs about $30. You don't need to fast for it. And labs actually measure ApoB more reliably than they measure LDL, because LDL is typically estimated using a formula while ApoB is a direct count. European cardiology guidelines already call ApoB more accurate than LDL. Clinical practice in the United States hasn't caught up.
What to Do With This Information
Next time you get blood work, ask for ApoB by name. Most labs can run it. Look at it alongside your LDL and figure out which of the four scenarios applies to you.
Know the target. Optimal ApoB is under 80 mg/dL. Your lab might print 120 as the upper limit of normal. Normal means average. Average in a country where cardiovascular disease is the leading cause of death is not the target you want.
Ask for Lp(a) at least once. If you've never had it tested, get it done. It's genetic, it doesn't change, and if it's elevated, that information changes how aggressively you should manage everything else.
Calculate your remnant cholesterol from your existing panel: total cholesterol minus HDL minus LDL.
And if you've ever been told your cholesterol looks fine on a standard panel while you were also experiencing unexplained symptoms, weight changes, or dietary experiments, consider whether a fuller picture might tell a different story.
The Bottom Line
Your standard cholesterol panel tells you how much cargo your trucks are hauling. It doesn't tell you how many trucks are on the road. ApoB counts the trucks. Lp(a) identifies a genetic risk factor that diet alone can't fix. Remnant cholesterol catches the stickiest particles that your panel doesn't report directly.
None of these tests are exotic or expensive. They're just not part of the default order. You have to ask for them.
Your food choices and lifestyle are the inputs. ApoB is the dashboard that tells you whether those inputs are working. If you don't measure it, you're flying without instruments.